
JTAG 103
Hardware Debugging
Where We Left Off & What's Ahead
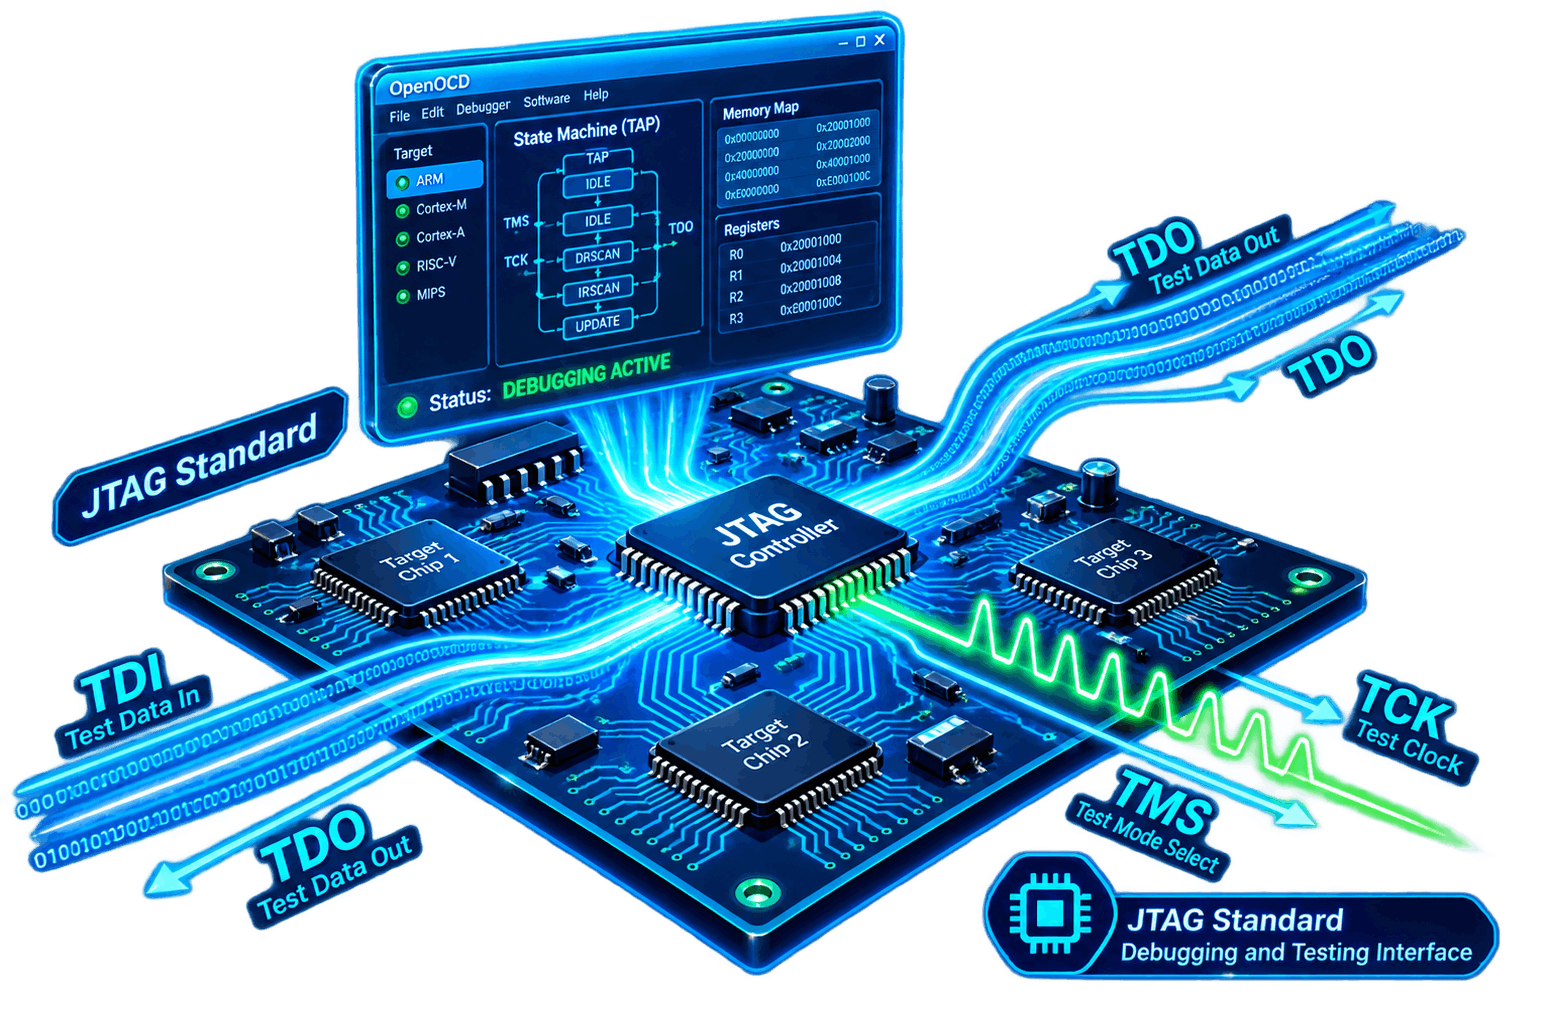
In the previous JTAG blogs, we covered the fundamentals of JTAG and learned how to identify JTAG pins on a device. In this part, we move into practical hardware debugging by connecting to a target device and communicating with it through its JTAG interface.
This section takes the concepts from the earlier JTAG lessons and applies them to a real target device.
Meet the Target: Arduino Due
For this hands-on demonstration, the target device is an Arduino Due. The board is useful for learning because it exposes a JTAG header and provides a practical platform for understanding hardware debugging.
The Arduino Due is based on the Atmel SAM3X8E ARM Cortex-M3 processor and is supported by commonly used embedded debugging tools.
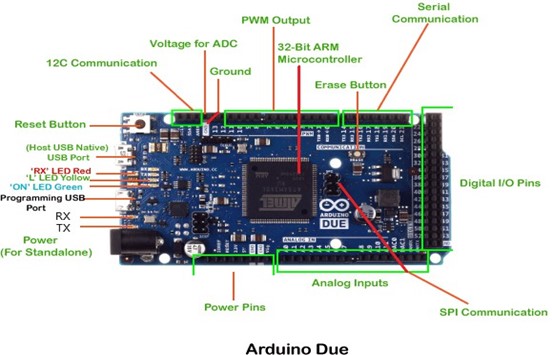
Once the Arduino Due is ready, identify the JTAG pins on the board. The important signals to look for are:
- TCK – Test Clock
- TMS – Test Mode Select
- TDI – Test Data In
- TDO – Test Data Out
- GND – Ground
The board markings and silkscreen can be used to identify the appropriate JTAG connections. The previous JTAG 101 and JTAG 102 lessons provide additional information about identifying JTAG interfaces.
Interfacing Devices for JTAG
To communicate with the JTAG interface, a hardware debugging adapter is required to act as a bridge between the computer and the target device.
Common hardware interfaces include tools such as the Shikra and Bus Pirate. These tools allow communication with the target's debug interface.
In this demonstration, the Shikra is used because it is simple to configure and works well for practical JTAG experimentation.
A Quick Look at the Shikra
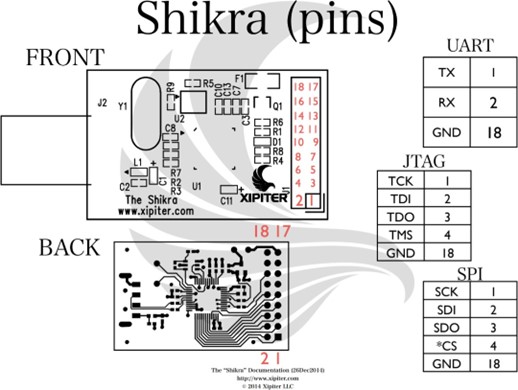
The Shikra is a compact hardware hacking tool that can act as a bridge between a computer and hardware debugging interfaces such as JTAG and UART.
It supports several protocols and can be used together with software such as OpenOCD.
The Shikra connects to the computer through USB and provides accessible pins that can be connected to the target device.
Connecting the Target Board to the Shikra
With the Arduino Due and Shikra ready, the next step is to connect the target's JTAG interface to the corresponding Shikra pins.
Jumper wires can be used to make the required connections. The primary signals are:
- TCK – Test Clock
- TMS – Test Mode Select
- TDI – Test Data In
- TDO – Test Data Out
- GND – Ground
Check the pinout carefully before powering the setup. Secure connections are important because loose jumper wires can cause unstable communication or prevent the debugging interface from working correctly.
After the connections are checked, connect the Shikra to the computer through USB.
OpenOCD
OpenOCD, or Open On-Chip Debugger, is an open-source tool that provides debugging and programming capabilities for embedded systems.
It supports interfaces including JTAG and SWD and can communicate with microcontrollers and other embedded devices.
In this setup, OpenOCD works as the software bridge between the Shikra and the Arduino Due. It provides access to target memory, registers, peripherals, and debugging operations.
- Reading and writing memory: Directly access memory locations on the target device.
- Stepping through code: Use debugging functionality such as breakpoints and controlled code execution.
- Flashing firmware: Upload and debug firmware on the target device.
OpenOCD supports different interface adapters and operating systems, making it useful for hardware hackers, reverse engineers, and embedded developers.
Checking the Connection
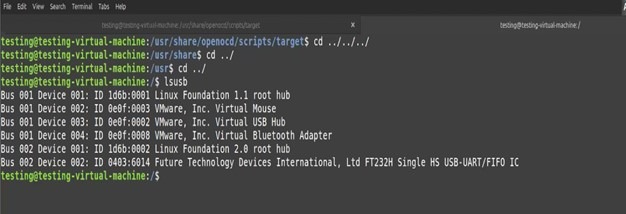
After wiring the Arduino Due to the Shikra and connecting the Shikra to the computer, verify that the USB connection is recognized by the system.
Open a terminal and run:
The lsusb command displays the USB devices detected by the system. The output can be used to confirm that the Shikra interface is visible to the computer.
Starting OpenOCD
Once the hardware connection has been confirmed, OpenOCD can be started using the appropriate interface and target configuration.
Use the following command:
What this does
The command specifies the Shikra as the hardware interface and selects the target configuration for the Arduino Due's AT91SAM3X8E microcontroller.
When the configuration is correct, OpenOCD initializes the interface and starts probing the target device.
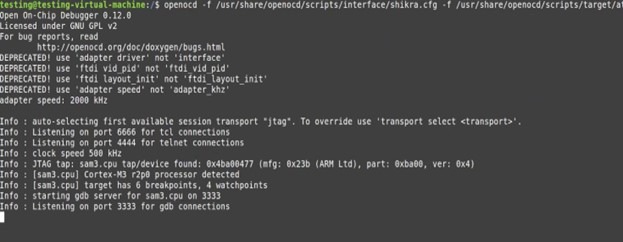
OpenOCD also starts a Telnet server by default on port 4444.
A Telnet connection can be established from another terminal window.
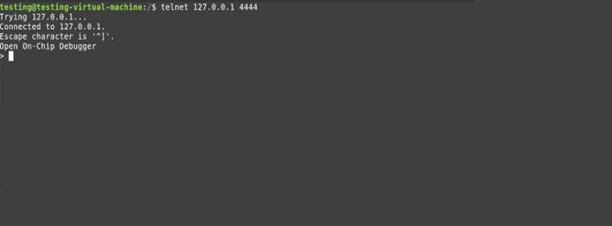
The OpenOCD command interface provides access to operations such as halting the CPU, inspecting memory, dumping flash contents, and interacting with the target.
Halting the Target Device
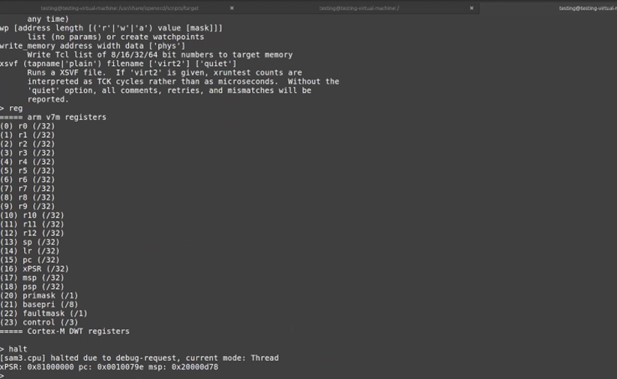
Once connected to the OpenOCD Telnet session, the target CPU can be halted using the following command:
Halting stops the microcontroller at its current execution point. This makes it possible to inspect registers and memory or perform debugging operations while the processor is stopped.
Reading Register Values
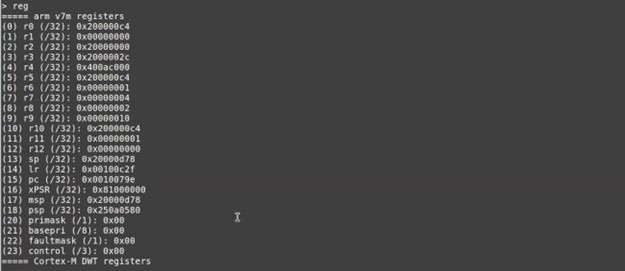
After halting the target, the CPU register state can be viewed with the reg command.
The command displays the current values of the processor registers. This information can help during debugging and hardware reverse-engineering activities.
Once control over the target has been established through JTAG, additional operations can be performed, including:
- Dumping memory regions
- Writing to selected memory addresses
- Modifying register values
- Resetting or stepping through firmware execution
These operations represent only part of what can be explored through OpenOCD. Its command set provides many additional capabilities for working with embedded targets.
Final Thoughts
This walkthrough demonstrates a practical JTAG debugging setup using the Shikra, OpenOCD, and an Arduino Due as the target. Starting from identifying the JTAG pins, the process continues through hardware connection, OpenOCD initialization, CPU halting, and register inspection.
JTAG provides many additional possibilities, including memory inspection, instruction stepping, firmware flashing, and other debugging operations.
This is only the beginning of practical hardware debugging. Further exploration of OpenOCD and its command set can provide a deeper understanding of the target device and its internals.

Learn in proficient
way to stay secured
Gain practical cybersecurity skills through expert-led training, real-world projects, and hands-on learning designed to prepare you for today's security challenges.


Address:
601, park plaza business center, S No. 296/2, Porwal Rd, Lohegaon, Pune, Maharashtra 411047
Phone: 91 8454095561
Email: [email protected]
©Copyright 2024 Unoacademy Labs LLP